The “Why” vs. The “What”: A No-Nonsense Guide to Qualitative vs. Quantitative User Research
Published by abyss.singh on

The "Why" vs. The "What": A No-Nonsense Guide to Qualitative vs. Quantitative User Research.
In the world of product design, marketing, and UX, “knowing your user” isn’t just a nice-to-have slogan; it’s the foundation of success. If you don’t know who you are building for, you are essentially throwing darts in the dark. But how do you get to know them?
Enter the two pillars of user research:
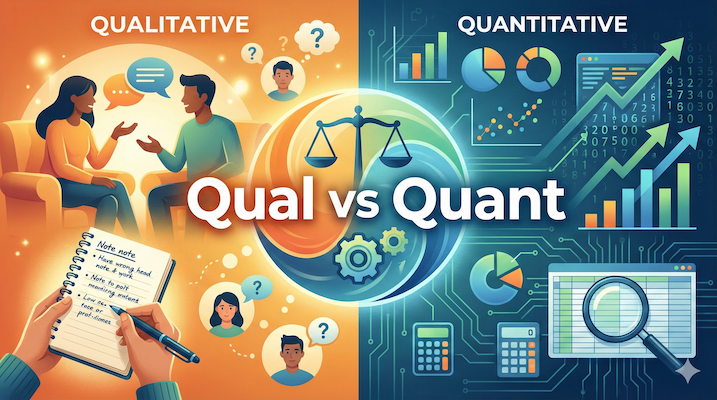
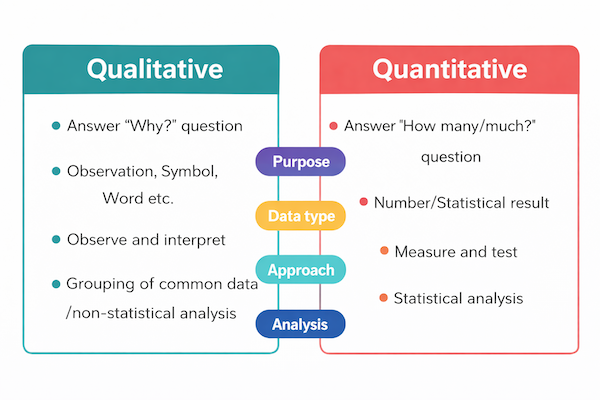
QUALITATIVE and QUANTITATIVE
If you’ve ever sat in a product meeting and heard someone say, “We need more data,” they are usually talking about one of these two things. Often, there’s confusion about which one is needed when, or worse, a belief that one is inherently better than the other.
The truth is, “Qual” and “Quant” are not rivals; they are partners. They answer fundamentally different questions. To build a truly successful product, you need both.
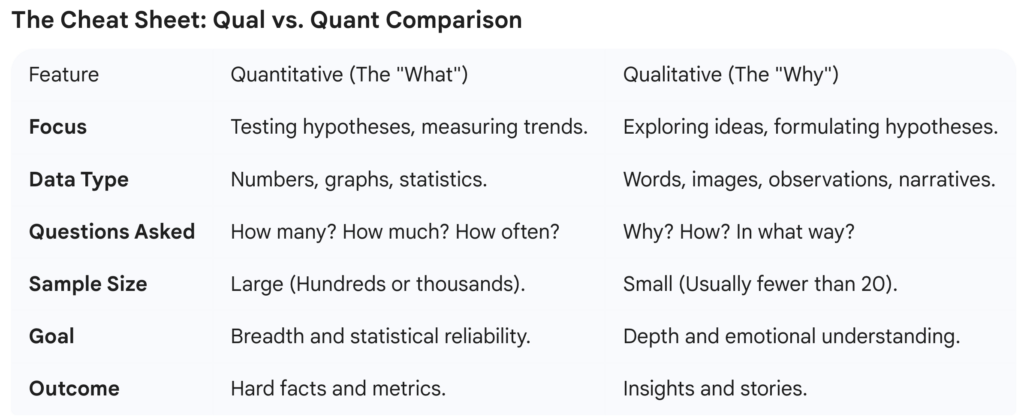
Here is a breakdown of the differences, the strengths of each, and how to use them together.

The 30-Second Overview
If you only have a minute, remember this analogy: “Think of your product as a crime scene you are investigating.”
Quantitative Research is the forensic evidence. It’s the fingerprints, the DNA samples, and the timeline. It tells you exactly what happened, where it happened, and how often it happens. It deals in hard numbers and undeniable facts.
Qualitative Research is the detective interviewing witnesses. It digs into motivations, alibis, and emotions. It tells you why it happened and adds human context to the hard facts.
You cannot solve the case—or build a great product—without both.

Quantitative Research: The “What” and “How Many”
Quantitative research is all about measurable data. It focuses on collecting hard numbers that can be analyzed statistically to uncover patterns, averages, and trends across a large group of people.
It is designed to answer questions like: “How many people visited this page?”, “What percentage of users clicked this button?”, or “Which headline performs better statistically?”
Common Quantitative Methods:
Analytics (Google Analytics, Mixpanel): Tracking user behavior on a live site.
Surveys (Large-scale): Asking closed-ended questions (multiple choice, ratings scales) to hundreds or thousands of participants.
A/B Testing: Comparing two versions of a design to see which yields better metrics.
Heatmaps: Visualizing where users click and scroll most often.
The Strengths of Quant:
Scale: You can gather data from thousands of users quickly.
Statistical Significance: It removes guesswork and provides “hard proof” to stakeholders.
Benchmarking: It’s easy to track performance over time (e.g., “Our conversion rate is up 2% since last quarter”).
The Weaknesses of Quant:
It lacks context: Analytics might tell you that 70% of users drop off at the checkout page, but it won’t tell you why. Are they confused? Is the price too high? Is the form broken? Quant can’t say.
Qualitative Research: The “Why” and “How”
Qualitative research is exploratory. It focuses on understanding the human experience—the motivations, thoughts, feelings, and pain points of your users. It deals in words, observations, and stories, not numbers.
It is designed to answer questions like: “Why do users find this feature confusing?”, “How does this product fit into their daily lives?”, or “What emotions do they feel when completing this task?”
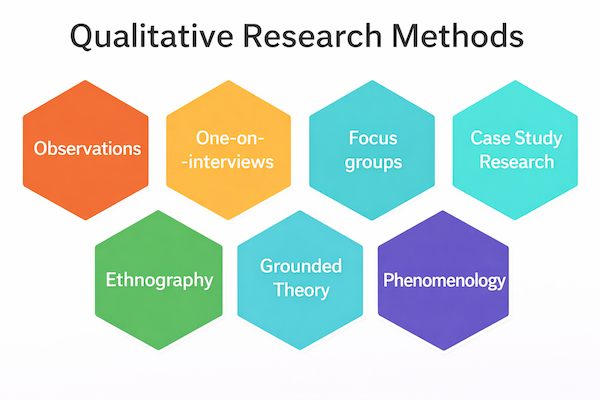
Common Qualitative Methods:
User Interviews: One-on-one deep dives into a user’s background, needs, and goals.
Usability Testing: Watching a user try to complete tasks on your product while they “think aloud.”
Diary Studies: Having users log their activities and thoughts over a period of time.
Contextual Inquiry: Observing users in their natural environment (e.g., watching someone use accounting software in their actual office).
The Strengths of Qual:
Deep Empathy: It’s the only way to truly understand the “human” side of your user.
Uncovering “Unknown Unknowns”: Quant answers questions you know to ask. Qual reveals problems you didn’t even know existed.
Explaining the “Why”: It provides the narrative behind the numbers.
The Weaknesses of Qual:
Small Sample Size: Because it’s time-intensive, you usually only research 5–20 people.
Not Statistically Significant: You cannot say, “Because 3 out of 5 interviewees said this, 60% of our total user base thinks this.”
Risk of Bias: The researcher’s own interpretations can sometimes influence the findings.
The Power of Mixing Methods (Triangulation)
The magic happens when you stop viewing these as an “either/or” choice and start using them together. This is often called “mixed methods research” or “triangulation.”
Here is the classic example of how they work together in a product cycle:
Step 1: Quant identifies the problem. You look at your Google Analytics and see a red flag: The drop-off rate on the “Shipping Information” page of your e-commerce checkout is 65%. Quant has told you where the problem is, but not why it’s happening.
Step 2: Qual diagnoses the cause. You run usability tests with 8 participants, asking them to go through the checkout process. You watch them struggle. You hear five of them say, “Wait, why is it asking for my phone number twice? That feels spammy.” Qual has provided the why.
Step 3: Quant validates the solution. You redesign the page to remove the redundant phone number field. You then run an A/B test (Quant) sending 50% of traffic to the old version and 50% to the new version. The new version reduces drop-off to almost zero. Quant has proven that your fix worked at scale.
Conclusion
Don’t get caught in the trap of favoring one method over the other. A spreadsheet full of numbers without human context is soulless; a handful of user stories without data to back them up is just anecdotal evidence.
To build great products, you need the breadth of quantitative data and the depth of qualitative insight. Use numbers to find the patterns, and use human connection to understand what those patterns mean.